How would have been our lives without debuggers? We would have been spreading print_r, echo and the like everywhere. Our world got better with tools like Krumo or (in the case of Drupal) with dpm(), but nothing like a real [IDE + debugger] couple like [PHPStorm + Xdebug].
If you also add DDEV and its docker containers to the mix, it’s not easy to get all pieces working, without a proper recipe. This article aims to be that recipe.
Preparing DDEV’s web container
DDEV automatically adds two environment variables to its .ddev-docker-compose-base.yaml file:
PHP_IDE_CONFIG=serverName=${DDEV_SITENAME}.${DDEV_TLD}
DRUSH_ALLOW_XDEBUG=1
Mind the serverName because we will need it later, when configuring a server in PHPStorm.
Now, we must config the Xdebug PHP extension. Create a new directory .ddev/php/ and create a file called xdebug.ini inside it, with this content.
xdebug.client_port = 9000
xdebug.idekey = PHPSTORM
xdebug.mode = develop,debug
xdebug.start_with_request = yes
I like to set xdebug.start_with_request=yes and turn on and off the web contaniner’s xdebug PHP extension with ddev xdebug on and ddev xdebug off. You could set xdebug.start_with_request=no and play with a browser switch like Xdebug Helper, but this won’t have effect on drush commands.
After that, we have to restart DDEV’s web container:
# ddev restartConfiguring PHPStorm
Now, we must create a new PHP server under Settings -> PHP -> Servers. Recall the server name we saw in DDEV’s config: it was ${DDEV_SITENAME}.${DDEV_TLD}, that translates to my-project.ddev.site if your DDEV project is named my-project.
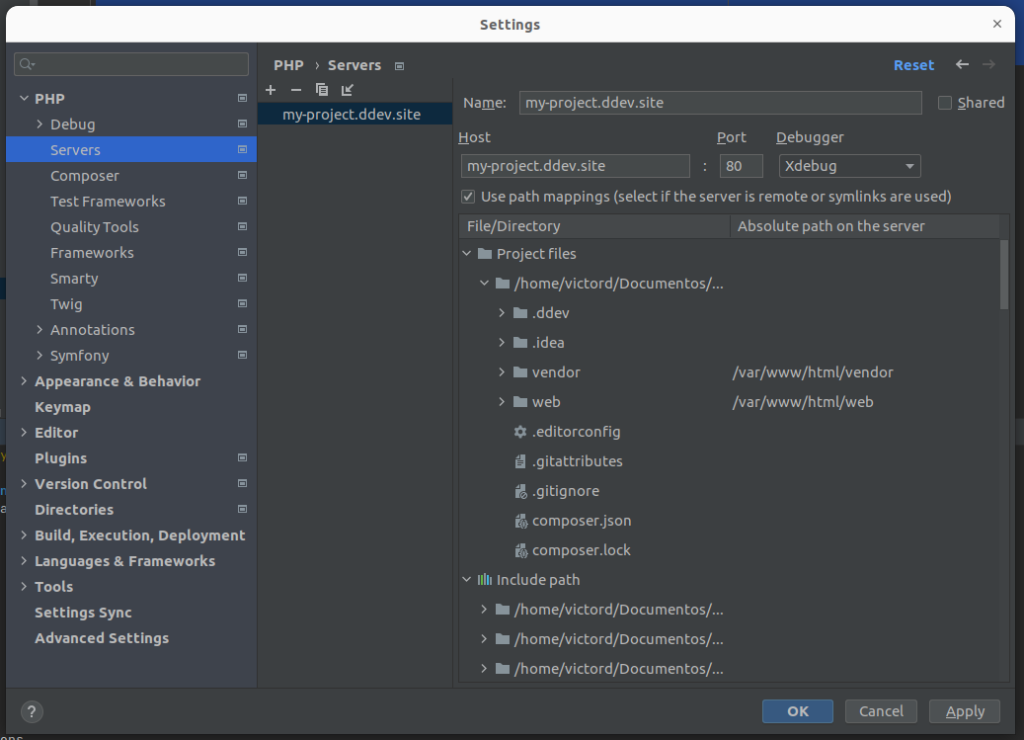
We need to set path mappings for the webserver docroot directory. A path mapping “maps” a real directory path in your filesystem with a directory inside the DDEV docker web container. In our case, a DDEV drupal project has its web server’s document root in /var/www/html/web, so we have to set this mapping:
/path/to/your/project/web -> /var/www/html/web
However, I recommend also adding this mapping to be able to debug vendor code.
/path/to/your/project/vendor -> /var/www/html/vendor
With these mappings, PHPStorm now knows how to map between the same file as it’s seen inside/outside DDEV’s web container.
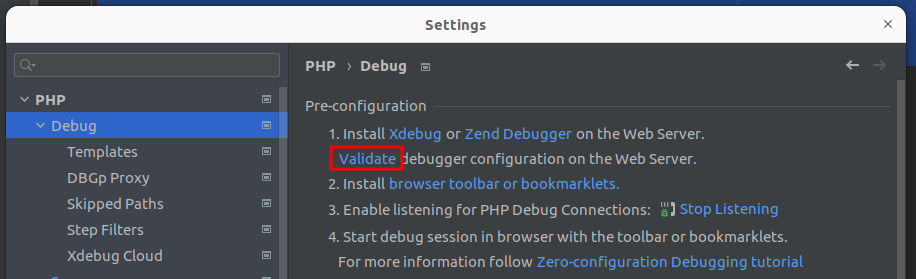
After that, to be sure everything is ok, I recommend checking and configuring the Xdebug installation under PHP -> Debug:
First, click on the “Validate” link:
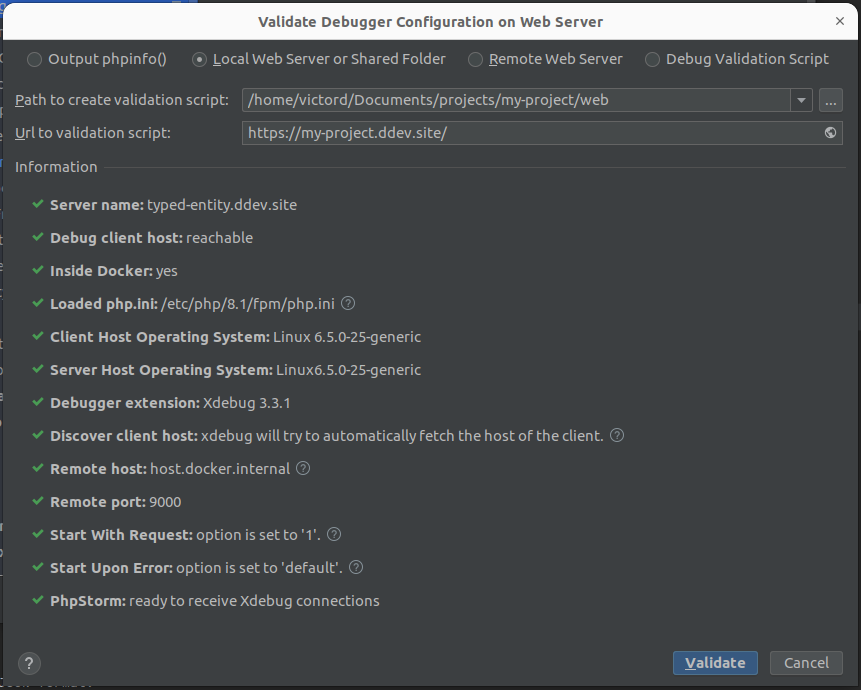
In the next screen configure the docroot directory as it’s seen by PHPStorm (your real machine path to the web directory inside your project directory) and the URL where the project’s docroot will be accesible. Then, click on “Validate”.
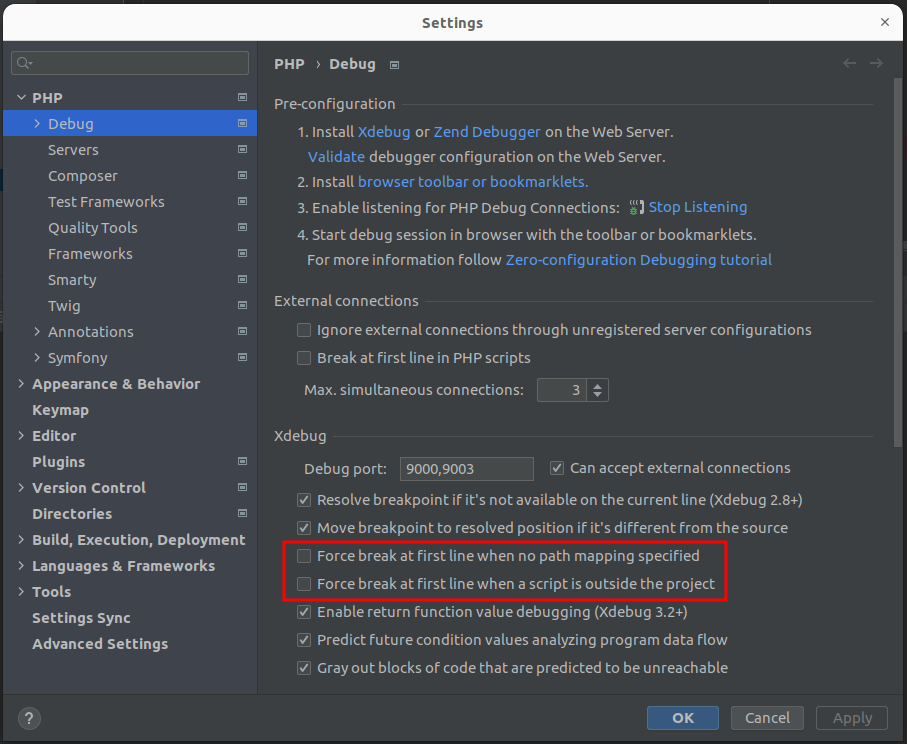
I strongly recommend unchecking these two “Force break” checkboxes, because we don’t want the execution to be paused if we don’t set or don’t reach a breakpoint. I remember myself waiting a drush command to finish unaware that the execution was paused, because of this.
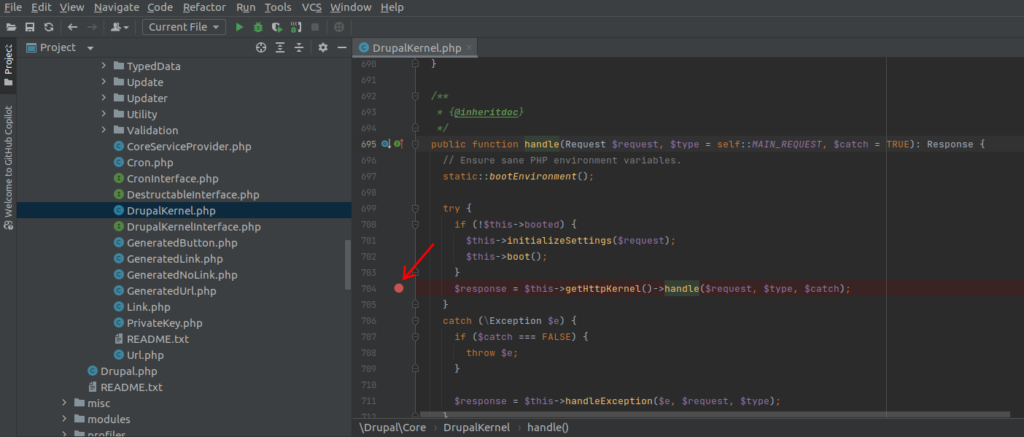
So far, we have configured DDEV and PHPStorm to “connect” between them and our next step will be to set a breakpoint. For example, we can break on the handle() call that Drupal\Core\DrupalKernel class does on every page load.
Click next to the line number and a red dot will appear. This is our breakpoint. The PHP execution will stop here until we let it continue.
Remember to enable xdebug PHP extension on DDEV’s web container with
# ddev xdebug onAnd to tell PHPStorm to listen to incoming debug connections with the  icon.
icon.
Now, reload any page in your browser and you will view a system notification letting you know that PHPStorm requires your attention. Go for it and you will see the breakpoint’s line highlighted and a panel where you can explore all the variables in it’s scope.
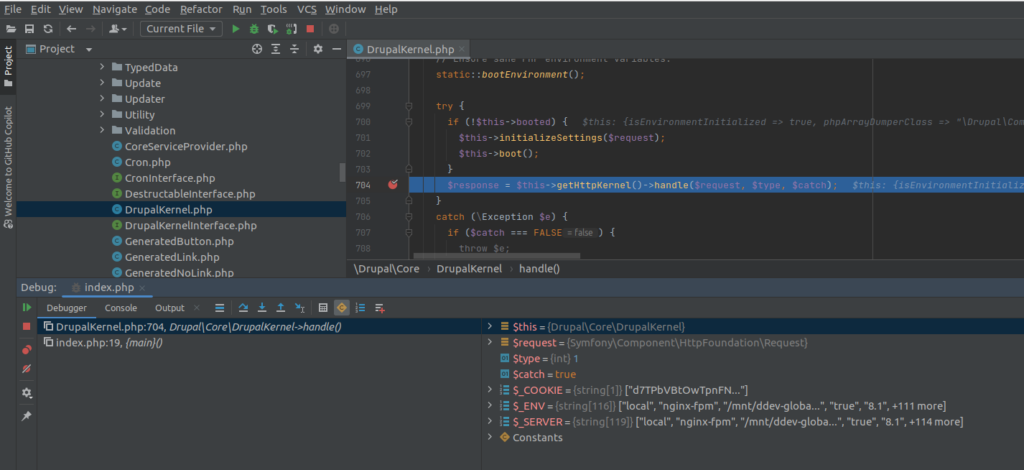
You can browse the variables panel and deep dive into the tree structures. This is VERY useful, specially when debugging a framework like Drupal that has many nesting levels on its variables.
You can also select any piece of code, right click on it and click on “Evaluate expression” and you could test it inside that paused execution state. You can even write directly your own expressions.
You can continue the execution step-by-step (step over, F8), even traveling inside method calls (step into, F7), or continue the execution until the next breakpoint (or the same breakpoint if it’s reached again)
Conclusion
Debugging goes next level when it’s done with a tool like Xdebug and through a debugging GUI like PHPStorm has.
